CrossingCharts is an advanced data presentation technology that fosters collaboration within interactive spaces providing compelling experiences to business and users.
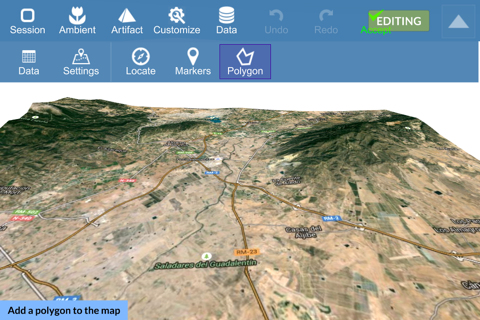
CrossingCharts allows you to create 2D and 3D data visualizations, including dashboards, 3D charts and maps with elevation.
Key features:
- State of the art visualization technology offers immersive exploration experience. Create beautiful work environments with gorgeous backgrounds and interactive data elements.
- Navigate in 3D using one of the 5 built-in modes + automatic index preview.
- Create professional dashboards that includes labels, texts, lists, charts, KPI elements and filters. Combine dashboards with 3D charts and maps for added visual impact.
- Map providers supported: Google Maps, Nokia HERE, ArcGis, MapQuest, OpenStreeMap, VirtualEarth and Sputnik.
- Built-in WYSISYG editor. Start from scratch from your mobile device.
- Cloud synchronization. Your presentation is safely stored in the cloud. Work across any number of devices and platforms.
- Connect to OpenData sources supporting CKAN protocol.
- Import data from CSV files online or send data from your applications to our cloud servers (ask us for details).
- Sharing options including screenshots, social network screenshot sharing and permalink generator for easy access to your projects.
Learn more at www.crossingcharts.com


